Online home of Philip Smith
Notes on volume and price indexes
used or produced in Industry Accounts Division
Philip Smith
March 18, 2020
The following notes are intended as starting points for discussions on various index number topics. They are not meant to be thorough, detailed or rigorous. To be thorough and detailed, some of the notes would have to be several pages long. To be rigorous they would have to be burdened with lots of algebraic expressions. For the more complex questions especially, it must be understood one can only go so far in a verbal discussion. Concentrated, heads-down reading and thinking are also required. The purpose here is to structure and motivate a verbal discussion on some specific issues, not to answer all questions about price and volume indexes definitively.
Readers of these notes will have different degrees of knowledge and experience with index numbers. Some may be recent newcomers to this domain. Others may be mid-level practitioners of the art of index number estimation, while some readers may be experts, more knowledgeable and experienced than the writer of these notes. Please bring your individual perspectives to the discussion, wherever you may be located on the knowledge and experience spectrum. Feel free to disagree with me. I might be wrong. Feel free to raise more questions.
Topics
1. What is deflation and how does it differ by division at Statistics Canada?
2. Why does Industry Accounts Division deflate?
3. Theory behind price and volume indexes in Macroeconomic Accounts Branch
4. Index number pyramids
5. Reference period versus base period versus link period
6. Index form versus value form for the volume estimates
7. Laspeyres volumes versus Paasche volumes
8. Usage of Laspeyres price indexes or unweighted price averages when Paasche price indexes are preferred
9. What’s good and what’s bad about fixed-weight Laspeyres
10. Fisher volumes context, history, core concept
11. What is a "superlative" index?
12. What is “chaining” and why is it done?
13. Chained Fisher (or chained Laspeyres or chained Paasche) volume aggregates measured in “chained dollars”?
14. Non-additivity of Fisher or any other volume index except fixed-weight Laspeyres
15. Contribution to percentage change
16. Why publish fixed-weight Laspeyres as well as chained Fisher volumes?
17. SUT annual deflation: Comparison of non-adjacent periods
18. SUT annual deflation: Provision of $C and $K for calculation of growth rates
19. SUT annual deflation: Calculation of Laspeyres and Paasche implicit price indexes and volume growth rates
20. SUT annual deflation: Are Laspeyres, Paasche and Fisher volumes and implicit price indexes comparable across industries and product classes?
21. SUT annual deflation: Why should we use nominal estimates and not volume estimates when calculating industry or product shares?
22. Practical matters: What to do when time series are broken or when product classifications change or when relative prices suddenly change a lot?
23. Spreadsheet example with annual data
24. Index numbers: Specification of pamphlets for users?
25. Summary of index number formulas
-----------------------------------------------------
1. What is deflation and how does it differ by division at Statistics Canada?
● The literal meaning of deflation is “to remove the effects of inflation”. This is done by dividing a (nominal) value time series by an appropriate price or a price index.
● A better definition of deflation is “to split a value series into two parts, one reflecting price changes and the other volume changes”.
● Always remember that a value series is a real-world fact, while the price and volume parts of a value series are, in almost all cases, purely analytical or conceptual rather than factual. The parts can be calculated many different ways. They are not unique. No method is perfect. In the real world, a particular method is neither right nor wrong, although there are good arguments about why one method is better than another.
● Aggregation of deflated series is not the same as deflation. We aggregate by using an index number formula, such as Laspeyres, Paasche or Fisher.
● Industry Accounts Division deflates annual sales and purchases, both for supply and use, by product class in the Supply and Use Tables (SUT) and produces annually chained Fisher volume and price indexes. The division also interpolates these annual estimates over the 12 months of the year and projects these monthly indexes beyond the last benchmark SUT year, using a Laspeyres aggregation tail formula. It also releases estimates of annual real GVA by province, using the Fisher formula, that are more timely than the SUT.
● National Economic Accounts Division deflates quarterly, low-level, final expenditure categories and uses a quarterly chained Fisher formula to aggregate to GDP. They use Laspeyres volume indexes to calculate capital and inventory stocks. They also update purchasing power parities (indexes through geography, rather than through time) coming originally from the Organization for Economic Cooperation and Development.
● International Accounts and Trade Division deflates monthly exports and imports of goods and produces chained Fisher volume and price indexes. They can do this because their monthly trade data, originating from Canada Border Services Agency, include detail on value, volume and price. The volume and price data can be used to calculate indexes in cases where the goods are fairly homogenous. They also use Producer Prices Division price indexes to deflate some exports and US and Japanese (and some other countries’?) price indexes for some imports.
● Economic Analysis Division uses Tornqvist-Theil price and volume indexes for annual multifactor productivity analysis and some other studies.
● Other divisions in Statistics Canada generally do not deflate, except for retail, wholesale and manufacturing sales, for which Laspeyres and chained Fisher indexes are published with help from Industry Accounts Division. Also, some divisions deflate incomes with the CPI, yielding “real income” time series.
2. Why does Industry Accounts Division deflate?
● It is the volume changes that economists and the media are most interested in. Volume, not value, drives employment, productivity and economic wellbeing.
● Always, and especially in times when inflation is highly variable, nominal value series are hard to interpret. This may appear paradoxical, since the value data are the only ones that are "hard numbers".
● But while volume is a more useful concept, it is far more difficult to specify clearly and measure accurately, compared to value. The volume concept is, of course, simple enough when it is applied to a single homogenous product, but the volume of a mixed bag of products is a very slippery concept. And the “all products supplied and used in Canada” mixed bag is very heterogeneous indeed.
● Real (volume) inputs and outputs are needed to understand changing production technologies and this is a primary use of the SUT. They are needed to calculate productivity, which is the driver of living standards and competitiveness.
● When it deflates the input and output value series it produces, IAD is also associating corresponding price indexes with those series. These price indexes are valuable to users of the volume series because they are required for the analysis of relative price change. Often increases or decreases in IAD’s volume indexes can be explained by decreases or increases in the corresponding price indexes. Relative price change is the force behind economic adjustment and reflects changing demand and supply influences. By watching relative price movements, economists learn about what is happening in the economy and can produce better forecasts.
● The SUT are deflated so users can understand the volumes of inputs of different product groups that are required to produce the volumes of output of different product groups. The real SUT data are vital for productivity studies. They are used to build complex economy-wide models that are used to analyze inflation, growth and economic policy actions. They are the ‘gold standard’ to which the estimates of monthly real gross value added (GVA) by industry (MGDP) and annual real provincial and territorial GVA by industry (PTGDP) are benchmarked and projected forward. But because they are so detailed and so definitive, they rely on income tax data, annual survey results and other administrative data sources that are not yet available when the MGDP and PTGDP preliminary estimates are prepared. They can only be published annually, 3 years after the fact, when these and other source data are available and can be used in the estimation process. Preliminary SUT estimates could, of course, be calculated more quickly, but they would not be the ‘gold standard’.
● The monthly GVA by industry estimates resolve the timeliness and frequency problems. They distribute the annual Canada-level SUT real GVA estimates over the 12 months of the year and they extend them forward using the Laspeyres fixed-weight tail formula. The chained Fisher formula would be preferred, but it is not feasible because gross outputs and inputs, and GVA-by-industry estimates at current prices are not available to recalculate the weights on a monthly basis.
● The annual provincial and territorial estimates of GVA-by-industry are also a more timely set of statistics than the SUT. They allow the regional economies to analyze their economic performance in real terms, two years before the full SUT become available. Unlike the monthly real GVA-by-industry estimates, the annual provincial and territorial ones use the chained Fisher method. They estimate annual GVA-by-industry at current prices in order to derive the aggregation weights for the volume and price indexes.
3. Theory behind price and volume indexes in Macroeconomic Accounts Branch
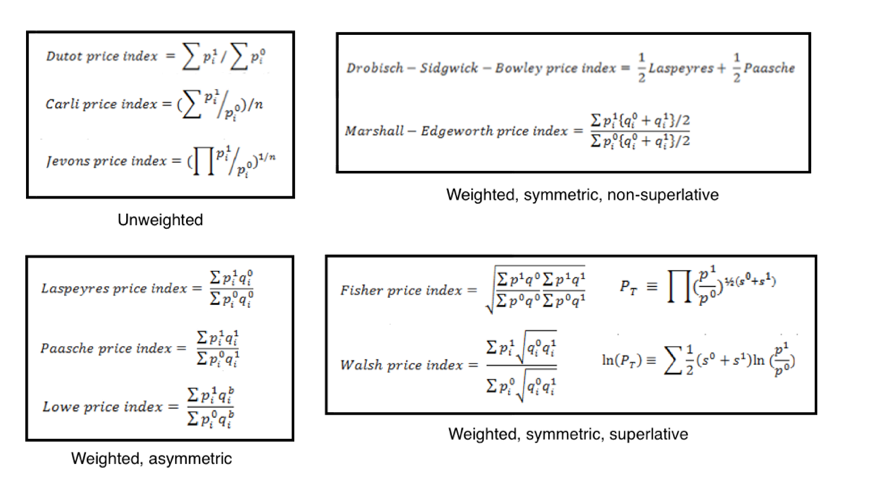
● Simple unweighted methods were introduced 300 years ago by Carli, Dutot and Jevons.
● Weighted but asymmetric methods were introduced about 150 years ago, by Laspeyres and Paasche.
● Weighted and symmetric "superlative" methods arrived in the 20th century, via Fisher, Tornqvist, Theil and Walsh. Diewert introduced the "superlative" idea.
We will discuss this further below in point 10, albeit in a summary fashion.
4. Index number pyramids
● Value series and corresponding price indexes generally have classification pyramids associated with them. Values are aggregated up the pyramid by simple addition, while price and volume indexes are aggregated with an index number formula such as Laspeyres, Paasche or Fisher. But what lies at the bottom of a price or volume index classification pyramid? These are the so-called elementary price and volume indexes.
● Price indexes at the bottom of a classification pyramid (eg. CPI and IPPI elementary indexes) are almost never Paasche or Laspeyres. Most often they are one of:
○ Unweighted geometric or arithmetric averages of sampled prices (Jevons, Carli, Dutot)
○ Judgementally weighted geometric or arithmetic averages of prices
○ Values divided by physical volumes (unit values)
○ Hedonic model results or, more rarely,
○ Lowe indexes.
● But rarely are they Laspeyres, Paasche or Fisher because there are usually no expenditure (or revenue) weights available at the bottom of the pyramid (although this may change as UPC scanner data become more easily available).
● For example, if Producer Prices Division is compiling a price index for motor vehicle tires it might send a qestionnaire asking for data on prices charged for a sample of different kinds and sizes of tire. It might also inquire about a few dimensions of quality associated with those tires, so it can make quality adjustments. A tire-producing firm might produce thousands of different tires for different makes of cars and driving conditions. It would be great if PPD could also ask how much of each kind of tire was sold during the month, so it could reweight its price indexes. But this is not practical. First, it would be an unjustifiable burden on the respondent. But most importantly the company probably does not have easy access to those data since accounts are not generally compiled on a monthly basis and this kind of detailed information is not generally contained in standard accounting statements anyway. So PPD has no weights for these tires and in fact will probably never have weights at this low level of detail. Instead, it must calculate either an unweighted average (or a geometric average) of the prices it collects or a partially weighted average where the weights are judgemental and apply to broad groupings of tire types. Accordingly, the tire price index is not Laspeyres, Paasche or Fisher. It is probably Jevons - an unweighted geometric average.
● There are 986 IPPI product indexes on CODR and 683 of these are lowest-level indexes. Some of the 683 are elementary indexes, calculated as above, while others are aggregations of two or more unpublished elementary price indexes. But none of the 986 IPPI indexes are ‘pure’ Laspeyres or Lowe indexes because they are all, ultimately, aggregations of non-Laspeyres indexes. It is simply too hard to collect and apply transaction value weighting at the sampling level.
● The issue of Laspeyres vs. Paasche vs. Fisher vs. other possible index number formulas is almost always relevant only above the bottom level, not on the bottom level itself. This is true in most price indexes in all countries because there is usually no practical alternative. National accountants must use whatever they can get for deflation at the bottom of the pyramid.
● When volume estimates are calculated in national accounting, the bottom level of the pyramid is where deflation is done. In other words, this is where volume indexes are calculated by dividing value series by price indexes, or sometimes by estimating volume directly (for example, electricity production volume can be measured by kilowatts of electricity generated, although I understand this is not actually the way electricity volumes are estimated in the SUT, no doubt for good reasons). Higher levels of the pyramid are calculated with Laspeyres, Paasche and Fisher aggregation, not by deflation.
5. “Reference period” versus “base period” versus “link period”
● A price or volume index tells us about changes, not levels. It has an arbitrary scale. Often that scale is set to 100 or 1 in some arbitrary period. That arbitrary period is called the reference period. Or a volume index might be set equal to the corresponding nominal value in some period and then referred to as constant dollars (or “K-dollars”) of that reference period. This can be called the ”value form”. But this is loose terminology and can be easily misunderstood by users.
● A value is measured in everyday Canadian dollars. When we say “current dollars” or “nominal” we mean “value”. Everybody knows what value means.
● A volume index is quite different. It has no units of measurement, only relative movements. People may not really understand what it means. After all, what is the volume of production of cars, clothing, financial services or vacations abroad? These product classes are heterogeneous.
● When economists talk about volume change they mean changes in value other than those that can be accounted for by changes in price. This means pure volume changes reflect not just changes in quantity but also changes in quality. For example, an automobile manufacturer might produce the same number of cars this period as last period, but if the producer economized by using less durable materials for its seats, it would be reducing output in volume terms and this must be reflected in the volume index.
● The base year of an index is the year from which the weights are calculated. The base year is often chosen to be the same as the reference year, but that is not necessarily the case. The two can be different periods and in the IPPI, for example, they are.
● Sometimes, rarely, a fixed-weight Laspeyres volume index has two or three base years combined, such as 1937-39. The base for a Fisher, or Tornqvist-Theil, or Walsh index is always two periods - the two periods that are being compared.
● A Laspeyres index, as Laspeyres himself defined it, must have a base period that is the same as the reference period. The Lowe index eliminates this requirement. The CPI and IPPI are both Lowe indexes, although they are often referred to as Laspeyres indexes. Lowe volume indexes are additive only if they are scaled to the base period values, not the reference period values.
● Proof, for the technically-minded: Lasp = Σp(0)q(t)/Σp(0)q(0). If the scale factor is the reference period value, we multiply by Σp(0)q(0), so Lasp = Σp(0)q(t). However, Lowe = Σp(b)q(t)/Σp(b)q(0). For additivity to be true for Lowe, the scale factor must be Σp(b)q(0), not the reference period value.
● Link periods are the periods where two indexes having different base periods are chained (linked) together. Chained indexes have multiple base years and their base periods are not necessarily the same as their link periods.
● In IAD, volume and price indexes are not published for the SUT. However, they are calculated annually and used internally to drive the MGDP and PTGDP estimates, to produce multi-factor productivity estimates and for other purposes. External users can also have access to the estimates, on request. The SUT estimates compare adjacent years, calculating L, P and F for each pair of years and chaining the results together. MGDP takes the chained F volume indexes from the SUT and interpolates them monthly. They produce preliminary monthly estimates beyond the last SUT reference year as a Laspeyres tail. PTGDP takes, from the SUT, the volume and price estimates for the provinces and calculates preliminary annual estimates for the F volume indexes for two years beond the last available SUT reference year.
● In sum: The reference, base and link periods of an index can all be the same period, or they can all be different periods. They are conceptually different things.
6. “Index form” versus “value form” for the volume estimates
● A volume index can be published in "index form" (scaled to equal 100 or 1 in some arbitrary period) or in "value form" (scaled to equal the value of the corresponding nominal value series in some arbitrary period).
● I like the index form because it shows the user very directly that a volume or price index has a level that is arbitrary. The index tells us about relative changes, not levels or absolute changes.
● Everyone seems to agree when it comes to price indexes. For example, no one (almost) ever wants to scale the IPPI to some kind of average price in dollars per unit of sales. That would not generally make sense, although it might rarely be reasonable for a low-level homogenous product.
● However, many people want to scale volume indexes to some kind of “constant dollars" (or “constant Yen”, “constant Euros” or whatever). Or they might call it “constant prices”. They want to be able to add up the volume indexes to get a total volume index. This has intuitive appeal, especially in national accounting where everything is measured in currency. In any kind of accounting, a big test of fidelity is whether or not the accounts "add up properly". And there are other reasons, discussed in point 9 below.
● The problem is that volume indexes are never additive in this way, except (mathematically) in the peculiar circumstances of unlinked fixed-weight Laspeyres indexes. Even then, the interpretation is only correct for the particular population and the particular configuration of purchases made in the base period. In the real world, demographic and preference changes through time invalidate this.
7. Laspeyres volumes versus Paasche volumes
● If we are comparing transactions "x" in only two periods, x(t) and x(t+n), the Laspeyres volume compares x(t) in t prices to x(t+n) in t prices. The Paasche volume compares x(t) in t+n prices to x(t+n) in t+n prices. Both approaches are reasonable, but Paasche might be marginally preferable because t+n prices are closer to today’s prices and are therefore more relevant today. Fisher, an average of the two, might be best because it is symmetric. As an average of Laspeyres and Paasche, Fisher cancels their respective biases.
● If we are comparing transactions in period t to transactions in a sequence of periods t+1, t+2, ...t+n, we might want to express all the transactions in the prices of a single period. It could be any period, but if we choose the "last" period t+n (Paasche), then on every occasion when another data point comes along, such as t+n+1, the whole series will have to be revised. It might be considered preferable to choose period t, or period t+k somewhere in between, as the base and reference period, to avoid revisions.
● This latter point is not relevant with IAD’s annually chained deflation or its annual real GVA by province program, but it is very relevant to its monthly real GVA-by-industry program for the months beyond the SUT annual benchmarks. (Even ignoring the revisions issue, the monthly real GVA-by-industry program cannot use the Paasche formula for volume aggregation since weights data are not available for the latest month.) The revisions issue is also relevant to NEAD’s quarterly fixed-weight-and-infrequently-chained Laspeyres program. It’s why they use Laspeyres rather than Paasche.
8. Usage of Laspeyres price indexes or unweighted price averages when Paasche price indexes are preferred
● Index numbers are used to split a value time series into a price part and a volume part. For example, nominal GDP rose 3.6% of which 2.1% was price increase and 1.5% was volume increase (1.036=1.021*1.015). It is easy to show arithmetically that if a Paasche price index is used for the price part and is used to deflate the current value series, then the implied volume part will be a Laspeyres volume index. If it is properly scaled, the Laspeyres volume index will be additive over products in periods following the base period. This was the approach taken in national accounts all around the world, until the Fisher approach as introduced by the US Bureau of Economic Analysis in the late 1990s, following recommendations of the Boskin Commission.
● However, Paasche indexes are seldom available for this calculation. So national accountants have always used other types of indexes as proxies. They use whatever is available, and often that turns out to be Laspeyres or Lowe price indexes, unit values, hedonic measures or other options.
● But it is easy to show arithmetically that a value series cannot be decomposed properly as the product of a Laspeyres price index and a Laspeyres volume index. Or of Lowe price and volume indexes either, for that matter.
● What is done, in fact, is to calculate a volume index by deflating with non-Paasche price indexes and to divide this volume index into the value series, yielding something called an "implicit price index" (IPI). While some may refer to this as a Paasche index, it is really an approximation to a Paasche index.
● What can be done about this? The only practical answer in my opinion is to be careful to call the IPI an IPI, or an implicit deflator, rather than a Paasche index, and to interpret it with considerable caution. That is what national accountants have always done.
● Is there a better solution? Scanner data provide a great solution, because we can use them to calculate L, P and F. But they are not yet easily available in a timely fashion. Are there other better solutions? Not that I can think of. Why don’t the IPPI and CPI produce Paasche indexes? Because they cannot get current value weight information.
● Finally, keep in mind that as long as one is prepared to accept that the deflated value series calculated this way are valid volume indexes, then since they are being aggregated up to GVA using the Laspeyres formula, the implied (implicit) price indexes can be taken as Paasche indexes. Only the volume index at the base - admittedly an important one - is just an approximation.
9. What’s good and what’s bad about fixed-weight Laspeyres
● Good: Since the fixed weights come from a base year that is the same as the reference year and the index is scaled by the reference year value, aggregation of Laspeyres volume indexes is easy - just add them up.
● Good: Fixed-weight Laspeyres indexes, properly scaled, can be interpreted as "constant prices of the reference/base period".
● Good: The growth rate of a fixed-weight Laspeyres index is the weighted average of the growth rates of its component parts and the weights are those of the Laspeyres index itself.
● Good: Laspeyres indexes are fairly easy (intuitive) to understand.
● Good: The relative weights of a Laspeyres volume index expressed in “value form” are obvious.
● Bad: Fixed-weight Laspeyres uses the weights (preferences) of the first of the two transactions being compared. Why ignore the weights (preferences) of the second of the two transactions being compared? This is unbalanced and biased. Laspeyres volume indexes will tend to mislead users by overstating real economic change and productivity growth. The Laspeyres-Paasche gap could be huge.
● Bad: The good things about fixed-weight Laspeyres only apply so long as the weights are fixed. But those weights typically become out-of-date very quickly, since relative prices and business cost functions or consumer preferences keep changing. That’s why we must chain. Once we have chained, all the good things about Laspeyres disappear, except perhaps within one particular link in the chain.
● Bad: If we need and care about long time series (longer than, say 2-4 years), the fixed-weight Laspeyres solution does not work. The Laspeyres bias (measured by the Laspeyres-Paasche difference) tends to grow too big, too quickly.
● Bad: Even if we only need and care about short time series, there is still a worry that the fixed-weight Laspeyres solution may not always work. Sometimes big and important relative price shifts come along rapidly, such as when the GST was introduced in 1991 or when oil prices suddenly sky-rocketed in the 1970s or dropped in 2015-16. In the context of the SUT, when relative prices are very different in years t and t+1, Laspeyres will be quite biased and the Laspeyres-Paasche gap could be huge.
● Bad: If users want additivity as well as long and chained Laspeyres time series, “adjusting entries” must be included with all aggregates. These have no useful interpretation and they perplex many users. Statistics Canada did this for decades, before switching to chained Fisher. The adjusting entries made users grumpy. Indeed, at times these entries were almost the largest components in GDP.
10. Fisher volumes context, history, core concept
● Indexes are about comparing two nominal transactions, A and B. For comparison purposes, you can restate A in B’s prices (Paasche) or B in A’s prices (Laspeyres). How to decide which? Both seem equally reasonable. Picking one means choosing one kind of bias or another.
● So why not take an average of the two? That’s Fisher.
● There are other types of average that can be used too: Tornqvist-Theil, Walsh, Marshall, etc. and they yield very similar, but not identical results.
● The history was:
○ Unweighted indexes - Carli, Dutot (1700s)
○ Weighted but asymmetric indexes - Laspeyres, Paasche, Lowe (1800s)
○ Weighted and symmetric but not superlative indexes - Drobisch, Sidgwick, Bowley, Marshall, Edgeworth (late 1800s and early 1900s)
○ Weighted, symmetric and superlative indexes - Fisher, Tornqvist-Theil, Walsh (1900s)
● The core Fisher concept is to accept both of the time-tested and intuitively appealing Laspeyres and Paasche concepts, and to take a (geometric) average. Give up the intuitively-pleasing additivity of indexes in exchange for the elimination of index-formula-caused bias.
11. What is a "superlative" index?
● The OECD online Glossary of Statistical Terms defines superlative indexes as “price or quantity indexes that are "exact" for a flexible aggregator. A flexible aggregator is a second-order approximation to an arbitrary production, cost, utility or distance function. Exactness implies that a particular index number can be directly derived from a specific flexible aggregator.”
● In essence, I understand a superlative index to be one that is unambiguously true, correct, exact, or perfect, in an idealized model of the world where convenient, but arguably fairly reasonable assumptions are made to allow cost and utility functions to be differentiable and well defined.
● Frankly, the superlative index concept is hard to fully comprehend for anyone who does not have excellent mathematical skills and the patience to work through some differential calculus. I do not have those skills or patience.
12. What is “chaining” and why is it done?
● “Chaining” is also called “linking”. It is a procedure to connect one index to another, in order to create a single, longer index. The index might be a price or a volume index. The chain might have one or two links, or dozens of links.
● Indexes have always been chained. In the income and expenditure accounts the volume indexes (real GDP and its components) were chained every 10 years in the 1950s, 1960s and 1970s. Then in the 1980s the chaining period was changed to every 5 years. Beginning in 2001 the chaining is quarterly.
● Why are indexes chained? It is because index users want them to be both relevant to current times, in terms of their weights, and lengthy, in terms of the number of years covered.
● Weights, reflecting the “relative importance” of the items comprising them, are central to most indexes. “Relative importance” weights are usually measured by expenditure or revenue or cost shares.
● Over lengthy periods of time, it would make no sense to retain a constant set of weights. The relative importance of different items changes as time passes. But every time the weights are changed, a new index is, in effect, being started. If users want a long, but relevant price or volume index, they must accept a “multiple indexes, all chained together” approach.
● Any index - Laspeyres, Paasche, Fisher, Lowe for example - can be chained. In fact, the headline national accounts measure, real GDP, is currently a period-to-period chained Fisher volume index. In the SUT and PTGDP volume estimates, the chaining period is annual. In the MGDP estimates it is annual as well, although in the most current (tail) MGDP estimates the chaining extends forward 2+ years from the last link. Chaining is quarterly in the income and expenditure accounts.
● Chaining allows long time series wherein each “era” has its own weights. But there are costs to chaining: Laspeyres chained volume indexes are additive within, at most, one link and volume indexes of any kind are subject to “drift”. “For example, suppose all the prices in the last period return to their initial levels in period 0, which implies that they must have fluctuated in between, a chain Laspeyres index does not return to 100. It will be greater than 100. If the cycle is repeated, with all the prices periodically returning to their original levels, a chain Laspeyres index will tend to “drift” further and further above 100 even though there may be no long-term upward trend in the prices. Chaining is therefore not advised when the prices fluctuate.” (international PPI manual).
13. Chained Fisher (or chained Laspeyres or chained Paasche) volume aggregates measured in “chained dollars”?
● Chained volume statistics are, without any doubt, the ones that matter most to users.
● But only their relative changes and contributions to change are meaningful.
● They are not additive and their "level" means nothing, although if scaled in “value form” their level does give a rough indication of their weight in larger aggregates, at least in the periods near the beginning of the chained volume index.
● In my opinion is unfortunate that we, like other countries, scale and label them as "chained dollars" rather than as [reference year]=100. The "chained dollar" is an undefined and misleading term.
● SNA 2008 recommends chained-Fisher volume estimates, but there is no explicit international recommendation about the “chained dollars” presentation as far as I know. The Americans were first to release their chained-Fisher estimates, back in the late 1990s, and they chose to publish the volume estimates as “chained dollars”. They did it that way, I believe, to make the transition easier for their users, many of whom found the change to non-additive chained-Fisher difficult to understand. We followed the practice when we adopted chained Fisher in 2001 because we wanted to be consistent with the Americans. So did other countries.
● My personal recommendation: Continue publishing “chained dollars” for now since this is what other countries are doing. Urge changes to this practise at the international meetings. In the meantime, do not show level results in analytical reports or tables.
● My personal recommendation: Do not calculate shares using chained volume series. There is usually no need to anyway. Use nominal series instead.
● My personal recommendation: Do not compare two different series measured in "chained dollars". Again, there is usually no need to. Compare the nominal series instead, or compare the relative changes. It is okay to calculate a ratio of two volume indexes, but only to derive another index. The ratio of a volume index of output to a volume index of input, for example, is an index of productivity. It tells us about relative changes in productivity, but it tells us nothing about the absolute level of productivity.
● My personal recommendation: Do not plot "chained dollars". Once agin, there is usually no need to. Plot percentage changes or cumulative relative changes (indexes starting at 100 or 1) instead.
14. Non-additivity of Fisher or any other volume index except fixed-weight Laspeyres
● Fixed-weight Laspeyres and Lowe indexes are the only special cases (apart from reverse-order Paasche). If the fixed weights are chosen as the values in year T (i.e. the base year is T) and the reference period is also chosen to be year T, then the levels of the Laspeyres volume index can be interpreted as values restated in the prices of year T, or as "constant dollars" of year T. But if a fixed-weight Laspeyres index is chained every year, or every 5 or 10 years as we did in the 1980s and 90s, the above statement is only true within one, and only one, particular link of the chain, not across a link.
● Fisher, Walsh, Tornqvist-Theil and other symmetric-weights index forms are non-additive, whether chained or unchained.
15. Contribution to percentage change
● With fixed-weight Laspeyres, the growth rate of an aggregate is the weighted average of the growth rates of the components, with the weights being the Laspeyres fixed weights. This is convenient and intuitively appealing.
No such property applies to other indexes (except Paasche, going backwards), or even to Laspeyres when a link is crossed.
16. Why publish fixed-weight Laspeyres as well as chained Fisher volumes?
● STC began focussing on fixed-weight Laspeyres volumes for final-expenditure-based GNP in the early 1950s. It continued doing so until 2001. That’s a very long time. Given a half-century’s experience, and the need for long, consistent time series, users are still attached to this measure.
● Users like the additivity in the fixed-weight Laspeyres volume estimates and may be willing to "pay the price" of index number bias in order to get it. They want the accounts to "add up properly". They like the fact that the growth rate of a Laspeyres index is the simple weighted average of the growth rates of its component parts. They like as well the fact that the weights of component indexes in an aggregate index are implied by their “value form” levels. In addition, they are still drawn to fixed-weight Laspeyres because they understand it better than chained Fisher, which is less intuitive.
● Fixed-weight Laspeyres indexes may be okay (fairly small bias) over short periods of time with stable relative prices - a few years, say. The Laspeyres tail for real monthly GVA-by-industry is only calculated for the most recent four years and that may be a short enough period, unless there are some big relative price shocks. The time series record shows that the monthly real GVA-by-industry estimates and the quarterly Fisher-chained estimates from the income and expenditure accounts have tended to be very similar. The real monthly GVA-by-industry series for earlier periods are interpolated from the Fisher chained volume measures in the SUT, so they have no bias in the further-back historical periods. Over longer periods, especially with big relative price shifts, a half-decade or more, say, fixed-weight Laspeyres can be very misleading. This could be demonstrated empirically by calculating Laspeyres-Paasche-Fisher gaps.
● So the problem is that fixed-weight Laspeyres has a bias that gets worse the further away from the base year we are. Strong price shocks (in energy or tech, or possibly due to the coronavirus, for example) aggravate the problem and we never know when the next big price shock will come. Shocks like these caused big problems in the macroeconomic accounts during the last five decades.
● Chain Fisher has no such bias and its weights are fully up-to-date. The rest of the world now uses Fisher too, so it’s best for international comparability purposes. For these reasons, Fisher is the headline measure and has been since 2001. We are gradually weaning users off Laspeyres.
17. SUT annual deflation: Comparison of non-adjacent periods
● Many people think of a temporal price or volume index as a sequence of measures comparing several adjacent periods, those periods being denoted t, t+1, t+2, ...t+n. The index values are actually a sequence of binary comparisons: t with t+1, t with t+2, t with t+3, etc.
● A temporal price or volume index can also be thought of as a single binary measure comparing a pair of not-necessarily-adjacent periods t and t+s. (Often these two periods are denoted 0 and 1 instead of t and t+s.) The Laspeyres, Paasche and Fisher formulas (and lots of other formulas) readily do that.
● If we compare t and t+s this way, what about the periods in between? How are they be portrayed by the index? They could be compared with a fixed-weight index like Laspeyres or Paasche, or with a chained index of any of the L, P or F varieties.
● The ideal solution, though, may be to provide users with a matrix of binary comparisons for each pair of years between t and s. So if the variable is output in the food processing industry, for example, the matrix would show the L, P and F price and volume indexes for output comparing periods (t and t+1), (t and t+2), … (t and t+s). You can imagine a matrix with these values of t along the columns and also down the rows. Each cell in the matrix would contain the seven numbers V, KL, KP, KF, PL, PP, PF. In this case, if a user wants to compare, for example, food output volume in period t with food output volume in period t+s, she can find the single cell in the matrix that compares t and t+s and use the binary L, P and F volume indexes for food.
● The computer could calculate and store this matrix easily, but it would be large and difficult to disseminate since there are hundreds of product classes and many pairs of years. Perhaps the demand for this information would be so small as not to justify the effort of producing it. Of course, as an alternative, such comparisons could also be offered strictly on a special request basis.
● If the chained volume and price indexes are used instead to compare food output volume in period t with food output volume in period t+s, she can use the chained L, P and F volume indexes for food that cover the period t through t+s. To me, this seems a more practical, albeit less exact solution.
● In addition, as an extra, IAD could offer users unchained, additive L indexes going forward from some arbitrary - and recent - reference and base year, as NEAD does. You could also offer unchained, additive P indexes going backward, if anyone was interested, though I expect few would be.
● These and other such matters could be explained to users in some kind of pamphlet. That, I think, would be very worthwhile. Then perhaps users could do some of their own chaining.
18. SUT annual deflation: Provision of $C and $K for calculation of growth rates
● Since users often want to calculate their own special aggregates or perform other calculations such as shares, they must have access to the value ($C) estimates. They are also interested in the price and volume indexes for growth rate calculations and so must be provided with those indexes.
● However, users should be strongly advised against aggregating indexes by addition or calculating index shares as if those indexes were “constant dollars” ($K). Only in the case of unchained, additive L indexes going forward can such aggregations be done, provided no links are crossed. But since users like to do these $K calculations, it is very helpful to them if you also provide those L indexes. They may be willing to accept some index number bias in exchange for additivity. But if we help them do this, we should also help them understand how big is the implicit cost they are bearing (the Laspeyres-Paasche-Fisher historical gaps).
● These and other such matters could be explained to users in some kind of pamphlet.
19. SUT annual deflation: Calculation of Laspeyres and Paasche implicit price indexes and volume growth rates
● Implicit price indexes (IPIs) have been published by NEAD for many decades, so they should continue to be published for continuity reasons. IAD should consider publishing price indexes using this nomenclature also.
● Moreover, users want price-volume decompositions that exactly account for value change, and IPIs are useful for this.
● But more thought is needed about the properties and true meaning of IPIs under different circumstances such as when the bottom-level deflators are:
○ Jevons or Carli or Dutot indexes
○ Laspeyres or Lowe or Paasche indexes
○ Unit values
○ Hedonic indexes
○ Chained indexes
20. SUT annual deflation: Are Laspeyres, Paasche and Fisher volumes and implicit price indexes comparable across industries and product classes?
● At a practical level yes, if one accepts them as best available measures of volume and price change. No statistical measures are perfect. We know that, but we use lots of them anyway.
● However, it is only the rates of change of the price and volume indexes that are comparable across industries and product classes. The index levels are not comparable or, indeed, even meaningful. That is why, in my opinion, it is better to publish indexes that are scaled to 100 or 1, rather than expressed in “value form”.
● At another more theoretical level, the answer is no. When deflation of two time series is done with different methods, or different weights, it’s apples and oranges. Different index number formulas answer different questions. It is preferable to use one deflation method consistently.
21. SUT annual deflation: Why should we use nominal estimates and not volume estimates when calculating industry or product shares?
● It’s because index levels are arbitrary. We can change the calculated shares just by changing the reference period. That opens up the possibility of “getting the shares you want by picking the reference period that gives them”.
● “Chained dollars” are a meaningless concept. I challenge you to define it. What’s the exchange rate between a chained dollar and an actual dollar? When users see the word “dollar” they think we are measuring volume in currency terms, but we are not.
● Anyway, what’s wrong with shares calculated using nominal data? The influence of general inflation is present in both numerator and denominator and therefore roughly cancels out in the ratio. It’s the nominal shares that matter in the real world, surely, and there is nothing theoretical or hypothetical about them. Unlike index numbers, they are authentic, natural, well-founded, understandable, unambiguous statistics.
22. Practical matters: What to do when time series are broken or when product classifications change or when relative prices suddenly change a lot?
● The practising deflation statistician encounters lots of other problems beyond those discussed here. For example, how to cope when the time series supplied by the survey divisions or administrative data sources are broken? An existing survey might be replaced by a new, redesigned survey. The source might adopt a new product classification. Or it might add new products and remove existing products from the survey scope. These and other very real practical problems are beyond the scope of these notes.
● Another practical problem occurs when a program is using a classical fixed-weight Laspeyres, or Lowe, index formula and relative prices change suddenly and dramatically. For example, world oil prices recently dropped from US$50-60 to around US$20. In such a case the weights might be updated right away, rather than waiting for the next scheduled rebasing. I believe this is sometimes referred to as “Paascheifying” because, like the Paasche formula, it introduces “current” weights.
23. Spreadsheet example with annual data
● There is a simple spreadsheet available for those who may be interested. It illustrates the calculation of L, P and F, chained and unchained.
24. Index numbers: Specification of pamphlets for users?
● It has been suggested that a pamphlet should be created that could be routinely provided to users of national accounts volume and price indexes. The intent would be to explain these indexes and to advise on how they should be used. What do people think of this idea? If it is adopted, how should the pamphlet be structured and written? I suggest it be written for the general user, rather than the specialist, and that it aim to be intuitive, with no equations.
25. Summary of index number formulas
● Below is a compact summary of the index number formulas mentioned here.
This web site is developed and maintained by Philip Smith